
LangFuse: Real Observability for AI Coding Agents
LangFuse is an open-source observability tool that gives you full visibility into every request an AI agent makes: what was sent to the model, what it cost, and whether the response was actually good.

When you work seriously with AI coding tools like Claude Code, or you're building your own custom AI app, there's a point where "it works" stops being enough. The logs are clean, tests pass, nothing throws an error, and yet costs suddenly triple, or response quality quietly drops for no obvious reason. The real problem: you have no visibility into what's actually happening between the request and the response. That's exactly the gap LangFuse fills.
What LangFuse Is
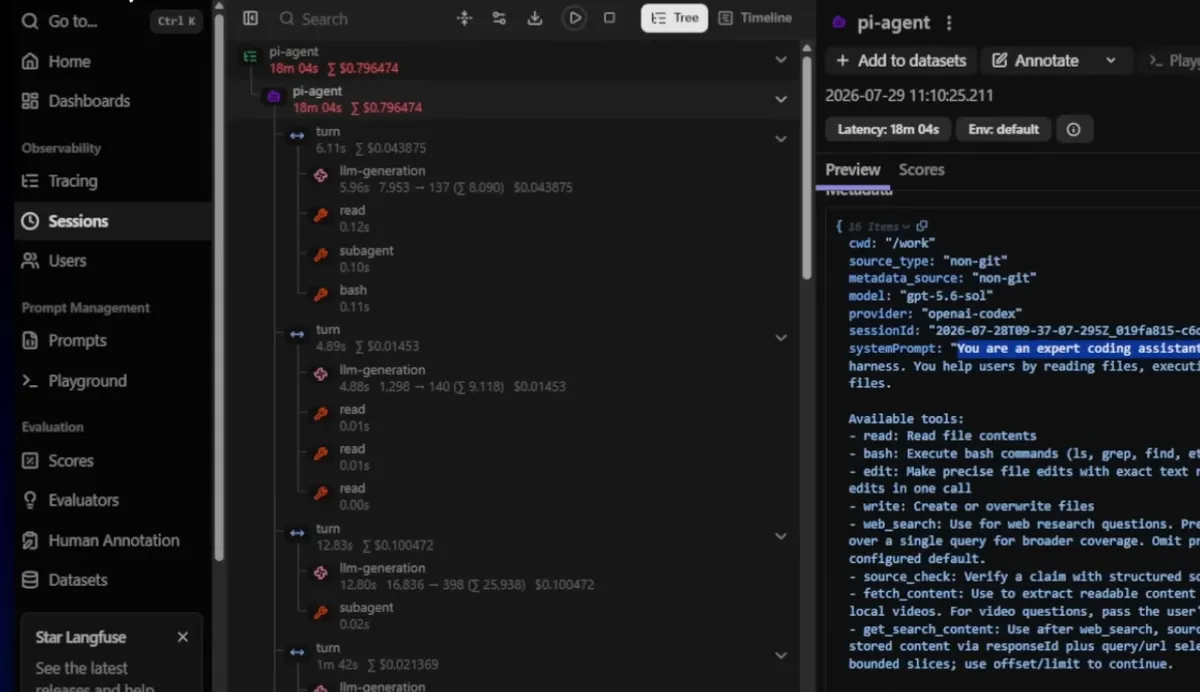
LangFuse is an open-source (MIT-licensed) observability tool you can self-host or use through their hosted tier, which includes a free plan. The core idea: a full trace of every request, exactly what was handed to the model (including the complete system prompt and tool definitions), what it did with that, what it cost, and how long it took. In short: x-ray vision into the agent.
Why This Matters Especially for Coding Agents
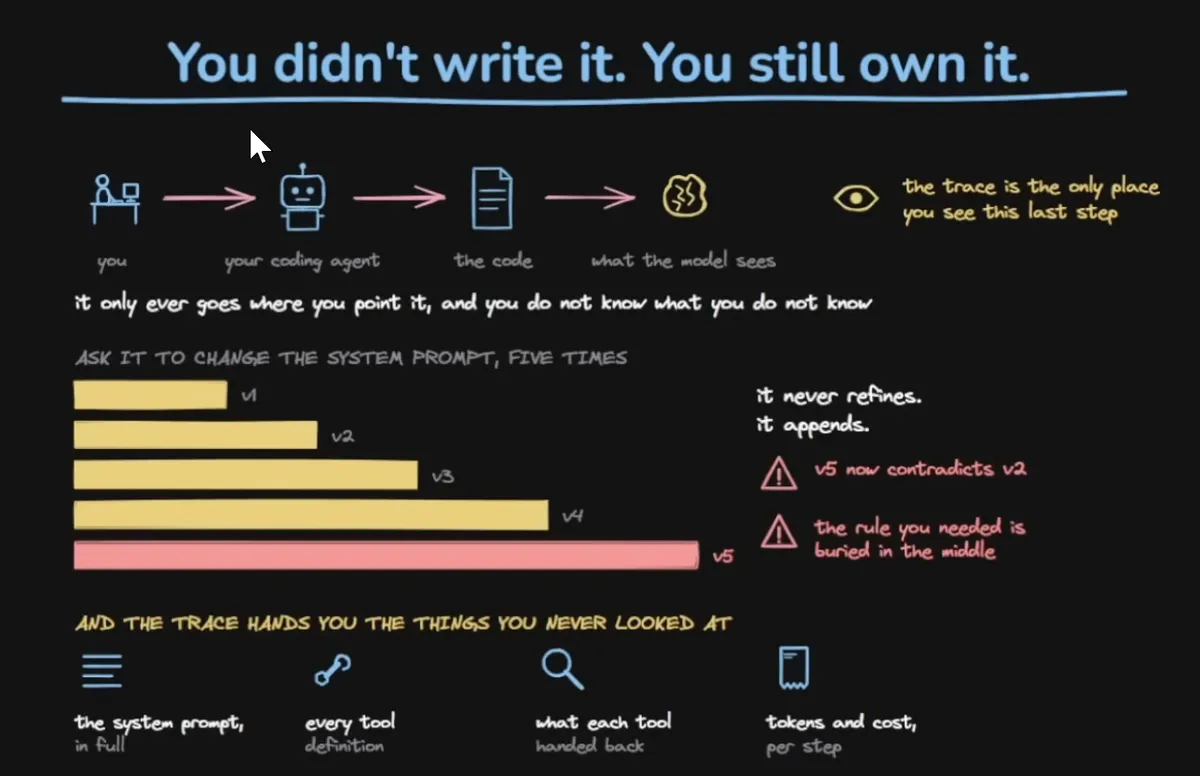
Coding agents like Claude Code or Codex write code for you, verify it works, and report success, but you almost never see exactly what was actually sent to the model. The most common issue: a system prompt that quietly bloats over time. When you ask an agent to update a system prompt several times in a row, it tends to just keep appending instead of rewriting, which creates internal contradictions that confuse the model in ways that are otherwise invisible. Without a full trace, there's no way to actually see that happening.
Another distinction worth knowing: open-source agents tend to expose a complete trace, including the full system prompt and every tool definition. Closed tools expose far less, you can see calls and responses, but not necessarily the full internal system prompt.
What a Trace Actually Shows You
- Every conversation (session) breaks down into traces, and each trace breaks down into individual turns and tool calls
- Exact cost per call, accounting for cached tokens
- Latency at every step
- For RAG-based apps: exactly which queries were sent to search, which documents came back, and how they were selected Here's the key point: an application can look completely healthy, no errors, all tests passing, and still give a wrong answer or behave incorrectly. That's the part below the waterline that only a full trace reveals.
Connecting It to a Coding Agent
The genuinely useful part: it's not just you who can read the trace, your coding agent can too, through a dedicated skill or LangFuse's MCP server. You can ask it to "pull the latest trace and figure out why that tool call failed," and it gets full visibility into both the codebase and the exact run that caused the problem. That's a real upgrade over ordinary logging.
Prompt Management and Versioning
Another feature: pulling prompts out of the codebase entirely and managing them inside the platform, with versioning. One version is marked as production; the code just requests it by name (cached locally so it adds no latency), and every trace carries the version that produced it, so cost, latency, and scores all line up against a specific prompt version.
Evaluating Quality
A trace tells you what happened, not whether the answer was good. Scores can come from a few places:
- Real user feedback (thumbs up/down)
- Human review from your team (QA, subject-matter experts)
- Deterministic code checks (for example: was a citation included)
- LLM-as-judge, for more subjective checks like hallucination detection Answers flagged this way can be added to an evaluation dataset, so a fixed problem doesn't quietly regress later.
A Note on Sensitive Data
It's worth explicitly checking that traces don't retain sensitive information that's supposed to be redacted. Even data that's correctly masked before reaching the model can end up logged inside the observability platform itself without anyone noticing, creating an unintended second copy of sensitive data elsewhere. This is worth auditing specifically, not assuming.
Hosting Options
- Self-hosted: a Docker Compose stack (Postgres, Redis, ClickHouse, MinIO), the simplest way to run it locally. Deployment templates also exist for Railway, Kubernetes, AWS, and Azure
- LangFuse Cloud: a free tier (around 50,000 units a month, note that units are counted by observations, not just traces, so a detailed trace can burn through the quota fast) Two alternatives worth knowing: Arize Phoenix (lighter-weight, but not fully open source, Elastic License 2.0), and LangSmith (simpler pricing, one trace equals one unit, but also not open source).
Takeaway
Once an AI agent or LLM-based app moves from side project to production, full visibility into what happens on every request stops being a nice-to-have. Without it, "it works" really just means "we haven't seen an error yet."
Follow us
TikTok · LinkedIn · X · Instagram · Telegram
Ready to automate?
Let’s build a system that works for you — not the other way around.